Table of Contents
- What Is a Fair Value Gap in Trading?
- What Causes a Fair Value Gap to Form?
- How Do You Identify a Fair Value Gap on a Chart?
- What Is the Difference Between a Bullish and Bearish Fair Value Gap?
- What Are the Different Types of Fair Value Gaps?
- Is a Fair Value Gap the Same as a Price Gap?
- What Is the Fair Value Gap Trading Strategy?
- Do Fair Value Gaps Always Get Filled?
- What Timeframe Works Best for Trading Fair Value Gaps?
- How Is a Fair Value Gap Different From an Order Block?
- What Are the Most Common Mistakes When Trading Fair Value Gaps?
- Can Fair Value Gaps Be Used on Any Market?
A Fair Value Gap (FVG) is a three-candle price imbalance that forms when the middle candle moves so aggressively in one direction that the first and third candles fail to overlap — leaving a price range that was never traded through equally by both buyers and sellers. This gap marks an inefficiency in price delivery. Because the market seeks to balance itself over time, price tends to retrace back into the zone to fill the imbalance before continuing in the original direction. In ICT methodology, fair value gaps are used as entry zones when they form after a liquidity sweep, align with the higher timeframe bias, and occur during a kill zone window.
What Is a Fair Value Gap in Trading?
A Fair Value Gap (FVG) is a three-candle price pattern where the middle candle moves so aggressively in one direction that it leaves behind a range of prices that were never properly traded through. The first candle and the third candle do not overlap, leaving a visible gap between them. That gap is the fair value gap — an area of imbalance where buyers and sellers never met at equal terms.
Price has a natural tendency to return to these zones. When it does, traders using ICT methodology look for the market to either find support inside a bullish FVG or find resistance inside a bearish FVG before continuing in the original direction.
Fair value gaps are one of the core PD arrays in ICT (Inner Circle Trader) and Smart Money Concepts trading. Understanding them properly — including the different types, how to identify them, and how to trade them — is essential to building a structured price action model.
What Causes a Fair Value Gap to Form?
A fair value gap forms because of aggressive institutional order flow.
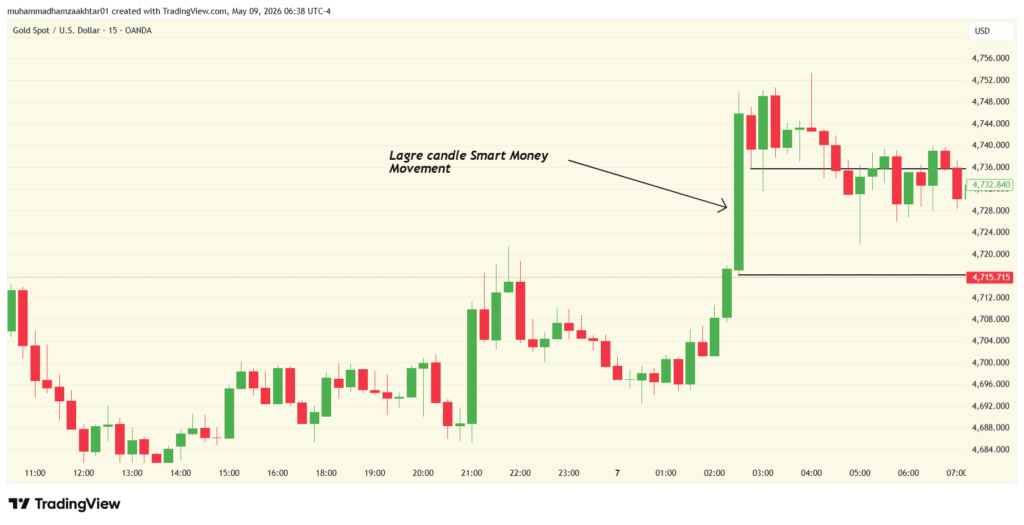
When large institutions — banks, hedge funds, algorithmic systems — execute massive buy or sell orders, they push price through a range so fast that the opposing side of the market cannot respond. Buyers and sellers never transact at those prices in a balanced way. One side completely dominated the auction.
That unbalanced move leaves behind an inefficiency. The market remembers it. Because price delivery is meant to be efficient over time, the market tends to retrace back into that gap to give the other side a chance to participate. That retracement is the fill.
In simple terms: a fair value gap marks a price range where the market moved too fast. The gap is the evidence. The fill is the correction.
How Do You Identify a Fair Value Gap on a Chart?
To identify a fair value gap you look at three consecutive candles and check whether the outer two candles overlap.
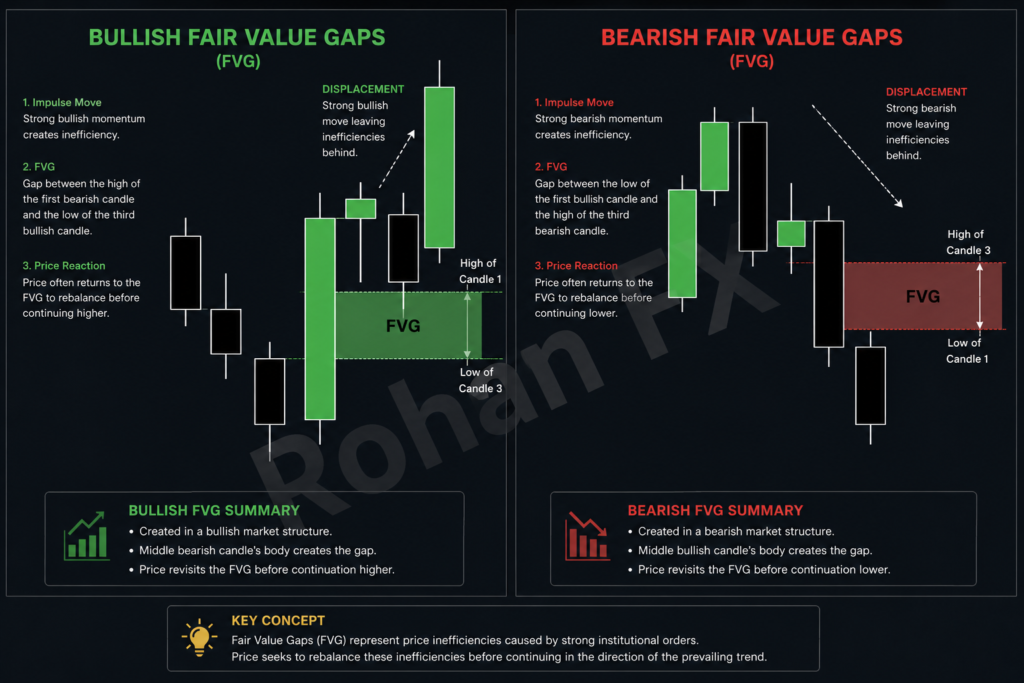
For a bullish FVG: look at the high of candle one and the low of candle three. If there is a gap between them — meaning candle three’s low is above candle one’s high — that space between them is the bullish fair value gap. The middle candle drove price aggressively upward and left an imbalance below it.
For a bearish FVG: look at the low of candle one and the high of candle three. If candle three’s high is below candle one’s low — that space is the bearish fair value gap. The middle candle drove price aggressively downward and left an imbalance above it.
The gap is always drawn as a rectangle covering the range between those two reference points. Most traders shade it on their chart so it is easy to spot when price returns to the zone.
FVGs are visible on every timeframe, but the most commonly used timeframes for spotting clean, reliable gaps are the 15-minute, 1-hour, and 4-hour charts. Higher timeframe FVGs carry more weight because they represent a larger institutional footprint.
What Is the Difference Between a Bullish and Bearish Fair Value Gap?
The direction of the impulse candle determines whether an FVG is bullish or bearish — and that determines how price is expected to behave when it returns to the zone.
A bullish fair value gap forms during a strong upward move. When price retraces back down into the gap, the expectation is that it finds support there and resumes moving higher. Traders look to buy from inside the bullish FVG, placing stops below the low of the zone.
A bearish fair value gap forms during a strong downward move. When price retraces back up into the gap, the expectation is that it finds resistance there and resumes moving lower. Traders look to sell from inside the bearish FVG, placing stops above the high of the zone.
| Factor | Bullish FVG | Bearish FVG |
|---|---|---|
| Formed by | Strong upward impulse candle | Strong downward impulse candle |
| Gap location | Between candle 1 high and candle 3 low | Between candle 1 low and candle 3 high |
| Expected reaction | Support — price bounces higher | Resistance — price rejects lower |
| Trade direction | Long (buy) | Short (sell) |
| Stop placement | Below the low of the gap | Above the high of the gap |
| Market context | Used in discount zones during bullish bias | Used in premium zones during bearish bias |
The bias of the gap always matches the direction of the candle that created it. A bullish FVG in a bearish market is a low-quality setup. A bearish FVG in a bullish market is equally weak. Direction of the gap must align with the higher timeframe narrative.
What Are the Different Types of Fair Value Gaps?
Not all fair value gaps are the same. ICT methodology identifies several variations, each with a specific behavior and use case in the trading model. Understanding these types separates traders who use FVGs mechanically from those who use them with real precision.
What Is a Standard Fair Value Gap?
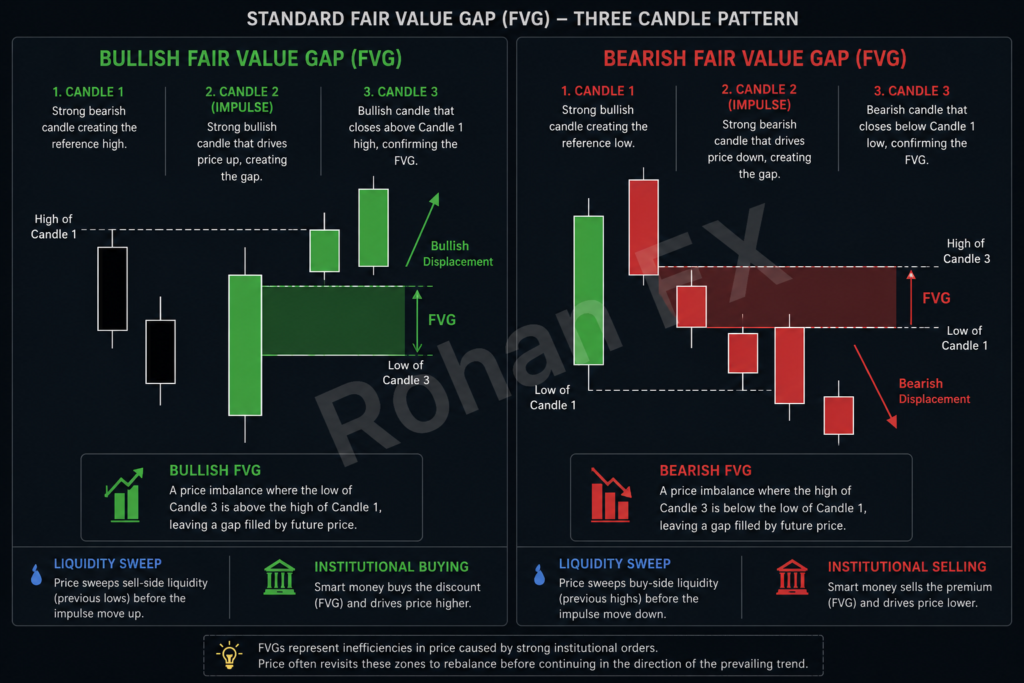
The standard fair value gap is the base pattern everything else builds from. Three candles. The middle candle moves hard in one direction. Candle one and candle three do not overlap. The gap between them is the imbalance zone.
This is the FVG most traders learn first. It is the foundation. Every other type listed below is either a modification of the standard FVG or a combination of it with another concept.
What Is an Inverse Fair Value Gap (IFVG)?
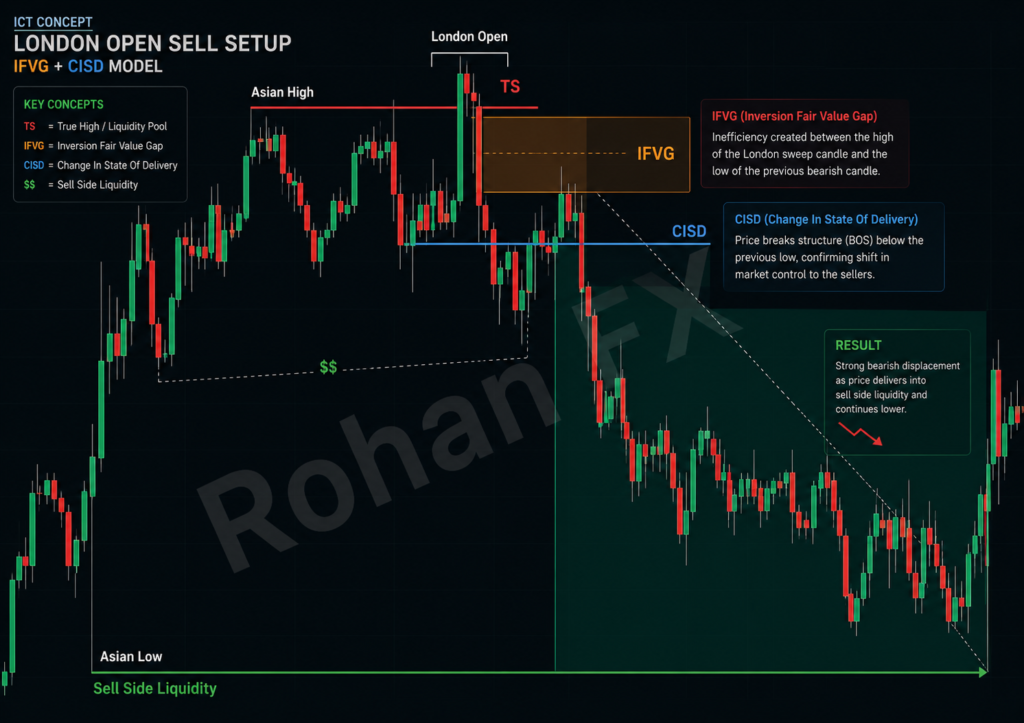
An inverse fair value gap forms when price passes through an existing FVG and closes beyond it — effectively violating the original zone.
When a bullish FVG gets broken — meaning price trades down through it and closes below the bottom of the gap — that zone flips from support to resistance. It becomes an inverse FVG. When price retraces back up into that same area, it now acts as a ceiling rather than a floor.
The same logic applies in reverse for a bearish FVG. If price breaks up through a bearish FVG and closes above it, that zone flips to support and becomes a bullish inverse FVG.
IFVGs are powerful because they identify levels where the original bias has been invalidated. The smart money that was defending that gap has exited. The zone has changed hands. Traders use IFVGs to position against weak-handed participants who are still expecting the original reaction.
What Is a Balanced Price Range (BPR)?
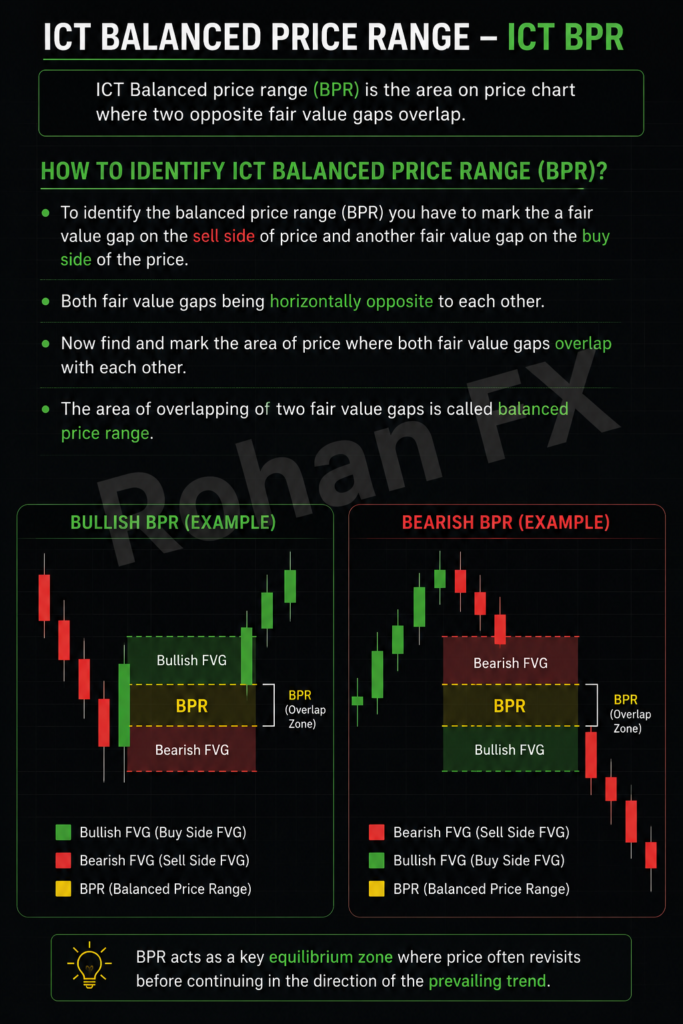
A balanced price range forms when a bullish FVG and a bearish FVG overlap in the same price area — either from opposing swings or across different timeframes.
The overlapping portion of the two gaps is the BPR. It is a zone where price has been delivered from both above and below. Buyers have shown up there and sellers have shown up there. That creates a highly contested area that the market tends to respect with strong reactions.
BPRs are considered higher-confluence than a standard FVG because they represent agreement between two separate institutional moves at the same price level. When price enters a BPR, the reaction is often sharper and more sustained than a standard FVG fill.
What Is Consequent Encroachment (CE)?
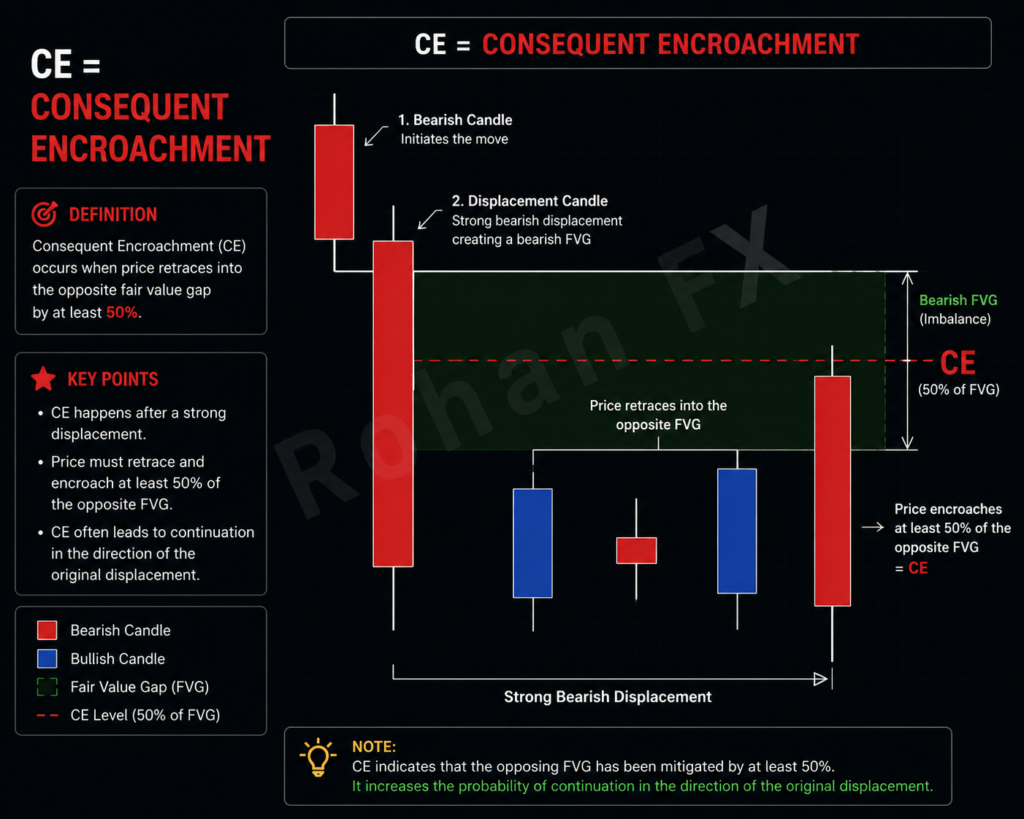
Consequent encroachment is the 50% level of any fair value gap. It is the midpoint of the zone.
Price does not always fill an entire FVG before reacting. Very often it reaches the CE — the midpoint — and reverses from there. This makes the CE a more precise entry reference within the gap. Instead of entering at the edge of the FVG and holding through the full range, a trader who understands CE can wait for price to reach the midpoint and enter with a tighter stop.
The CE also acts as a reference for partial fills. If price has already traded to the CE of an FVG on a previous visit, the remaining portion of the gap (from CE to the far edge) is still considered an open imbalance and may still attract price in the future.
What Is a Unicorn Model FVG?
The unicorn model is a high-confluence setup where an order block and a fair value gap stack directly on top of each other in the same price area.
The order block marks the last opposing candle before a strong impulsive move — the candle where institutional orders were placed. The FVG is the imbalance left by that move. When these two elements occupy the same zone, you have both the origin of the institutional order and the evidence of imbalance confirming it.
When price retraces into a unicorn zone, traders treat it as one of the strongest entry models in ICT methodology. The order block anchors the entry and the FVG provides structural confirmation that the move was institutionally driven.
What Is a Propulsion Block and How Does It Relate to FVGs?
A propulsion block is a fair value gap that forms at the very base of a strong impulsive move — the gap left at the origin of a major leg, not somewhere in the middle of it.
The location is what makes it distinct. Because it sits at the launch point of the impulse, it signals that the move was driven by significant participation right from the start. There was no buildup, no slow grind — price launched from that level with force and left an imbalance behind immediately.
When price retraces back into a propulsion block, it tends to act as a launchpad for the next leg in the same direction. Traders treat it as a high-probability continuation setup, particularly when it aligns with a higher timeframe draw on liquidity.
What Is a Volume Imbalance vs a Fair Value Gap?
A volume imbalance is a related concept but it is not the same as a fair value gap and it should not be traded the same way.
A volume imbalance forms when two adjacent candle bodies have a gap between them but the wicks of those candles do partially cover the range. The bodies did not overlap but the wicks reached into the space. This means some price discovery happened in that range — it just was not sustained.
A true fair value gap has no overlap between candle one and candle three at all — not bodies, not wicks. The range was never traded through in any meaningful way.
| Factor | Fair Value Gap | Volume Imbalance |
|---|---|---|
| Structure | Three-candle pattern | Two adjacent candles |
| Wick overlap | No overlap between candle 1 and candle 3 | Wicks partially cover the gap range |
| Body overlap | None | None (bodies do not meet) |
| Strength | Strong imbalance — no price discovery occurred | Weaker imbalance — partial price discovery via wicks |
| Fill speed | Slower — can remain open for sessions or days | Faster — often fills within the same session |
| Trading reliability | High when in proper context | Lower — less clean reactions |
| Use in model | Primary entry zone | Supporting confluence only |
Volume imbalances are considered weaker inefficiencies. They should not be used as primary entry zones without additional confluence from a proper FVG, order block, or liquidity sweep.
Is a Fair Value Gap the Same as a Price Gap?
No. These are two different things that traders often confuse.
A traditional price gap — also called a gap up or gap down — happens between the close of one candle and the open of the next. It is most common in stocks between the closing bell and the next morning’s open, or in forex pairs after the weekend. There is literally a blank space on the chart where no trading occurred.
A fair value gap exists within continuous price action. There is no blank space on the chart. Price was moving the entire time — it just moved so fast and so one-sided that the range was left imbalanced. The three candles are all present. The gap is an inefficiency, not an absence of trading.
| Factor | Fair Value Gap | Traditional Price Gap |
|---|---|---|
| Cause | Aggressive institutional order flow during live trading | Market closure — overnight, weekend, earnings |
| Chart appearance | No blank space — all candles are present | Visible blank space between two candles |
| Structure | Three-candle imbalance pattern | Two-candle open/close mismatch |
| Market type | Appears in all markets including 24hr forex | Common in stocks and session-based markets |
| Fill behavior | Returns during retracement phases | Often fills but timing varies widely |
| Trading model | PD array used for entries in ICT methodology | Gap fill trade — separate strategy |
Both concepts involve price returning to fill an unresolved area. But a traditional price gap is structural (caused by market closure) while a fair value gap is behavioral (caused by institutional aggression during live trading).
What Is the Fair Value Gap Trading Strategy?
The fair value gap is not traded in isolation. The complete ICT model wraps the FVG inside a sequence — liquidity sweep, market structure shift, kill zone timing, and then entry into the gap. Each step filters out low-quality setups and keeps you aligned with institutional order flow.
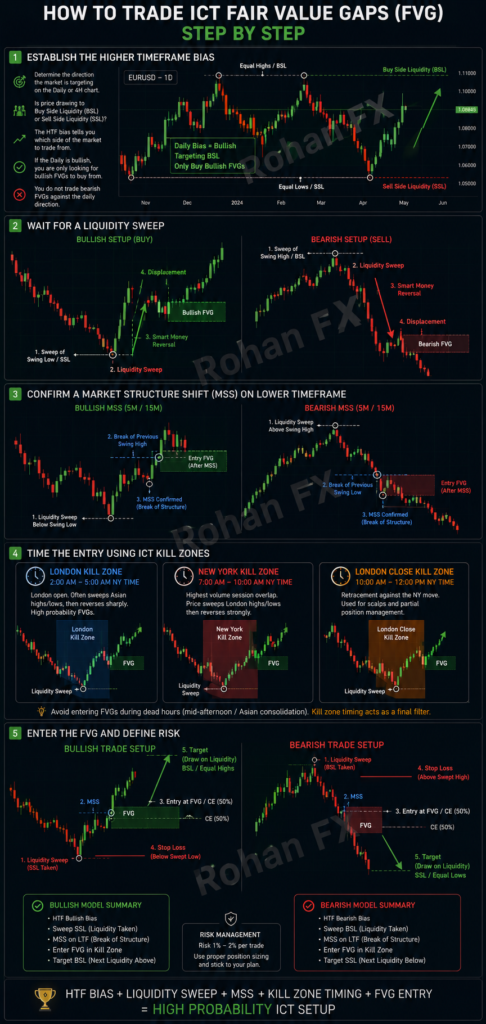
Step 1 — Establish the higher timeframe bias
Before looking at any FVG, determine the direction the market is targeting on the daily or 4-hour chart. Is price drawing to buy side liquidity (equal highs, previous swing highs, BSL) or sell side liquidity (equal lows, previous swing lows, SSL)? The HTF bias tells you which side of the market to trade from. If the daily is bullish, you are only looking for bullish FVGs to buy from. You do not trade bearish FVGs against the daily direction.
Step 2 — Wait for a liquidity sweep
The setup does not begin until liquidity has been taken. Price needs to sweep a significant level — a swing low, a session low, equal lows, or a stop cluster — before you look for an FVG to enter from. The sweep is the trigger. It tells you smart money has collected orders and is ready to reverse. An FVG that forms without a prior liquidity run has no institutional narrative behind it. It is just a pattern on a chart.
In a bullish setup this looks like: price runs below a swing low, takes out all the sell side liquidity sitting there, then aggressively reverses upward — leaving a bullish FVG on the way back up.
In a bearish setup this looks like: price runs above a swing high, takes out all the buy side liquidity sitting there, then aggressively reverses downward — leaving a bearish FVG on the way back down.
Step 3 — Confirm a market structure shift on the lower timeframe
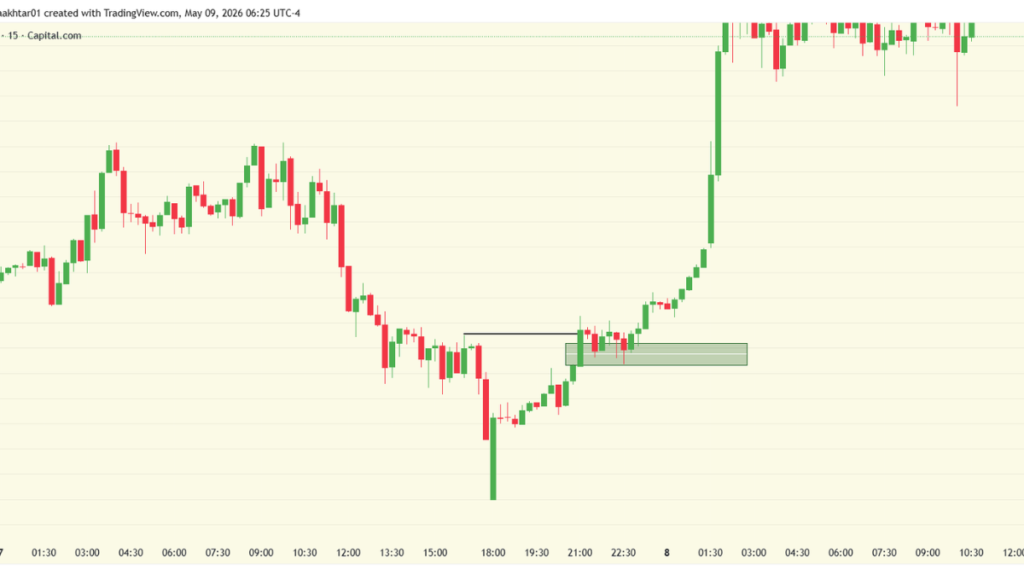
After the liquidity sweep, drop to the lower timeframe (5-minute or 15-minute) and confirm that market structure has shifted. For a bullish setup, you need to see the lower timeframe break above a previous swing high after the sweep — this is the market structure shift (MSS) confirming that the reversal is real. For a bearish setup, price breaks below a previous swing low on the lower timeframe after the sweep.
The MSS candle itself often leaves a fair value gap. That gap — formed right at the shift in structure — is typically the entry zone.
Step 4 — Time the entry using ICT kill zones
This is where kill zone timing becomes critical. Not every hour of the trading day produces clean, institutional price delivery. ICT kill zones are the specific windows when banks and institutions are most active and when FVGs are most likely to be respected.
The three primary kill zones for FVG entries are:
London Kill Zone (2:00 AM – 5:00 AM New York time): This is the opening session for European institutions. The London kill zone frequently produces the day’s first major liquidity sweep, followed by a sharp directional move. Bearish FVGs formed during London sweeps of Asian session highs are strong setups. Bullish FVGs formed during London sweeps of Asian session lows are equally reliable.
New York Kill Zone (7:00 AM – 10:00 AM New York time): This is the highest-volume session overlap. The New York kill zone is where the majority of ICT Silver Bullet and kill zone models are executed. Price frequently sweeps London session highs or lows during the first 30 to 90 minutes of New York, then reverses sharply. The FVG left on that reversal — inside the New York kill zone window — is the target entry.
London Close Kill Zone (10:00 AM – 12:00 PM New York time): This window often produces a retracement against the morning New York move. Institutions use this period to partially close positions. FVGs formed during this window tend to be smaller and are used for intraday scalp entries rather than full-session trades.
Entering an FVG outside of a kill zone — during dead hours like the mid-afternoon or the Asian consolidation range — significantly reduces the probability of a clean reaction. Kill zone timing acts as a final filter.
Step 5 — Enter the FVG and define risk
Once the FVG is identified inside the correct kill zone, after a liquidity sweep, with an MSS confirmed, you enter the trade.
For a bullish setup: place a limit order at the FVG or at the CE (50% of the gap). Stop loss goes below the low of the FVG or below the swing low that was swept. Target is the next draw on liquidity above — the previous swing high, equal highs, or BSL.
For a bearish setup: place a limit order at the FVG or CE. Stop loss goes above the high of the FVG or above the swing high that was swept. Target is the next draw on liquidity below — previous swing low, equal lows, or SSL.
The complete sequence — HTF bias, liquidity sweep, MSS, kill zone timing, FVG entry — is what makes the setup institutional. Skipping any one of these steps reduces the model to pattern recognition. Following all of them is what separates a high-probability FVG trade from a random entry into a zone.
Do Fair Value Gaps Always Get Filled?
No. Not every fair value gap gets filled, and not every filled FVG produces a clean reaction.
In strongly trending markets, price can leave behind multiple FVGs on the way up or down and never retrace to fill any of them — at least not during that trending phase. The gaps remain open and may only get filled during a deeper correction weeks or months later.
Higher timeframe FVGs (4H, Daily, Weekly) tend to sit open for longer. Lower timeframe FVGs (5M, 15M) fill much faster, often within the same session.
The more important point is this: not every FVG is worth trading even if it does fill. A gap that forms in the wrong location, against the higher timeframe bias, or in a range where liquidity has already been taken, is a low-quality setup. Chasing every FVG fill is one of the fastest ways to bleed an account using this model.
What Timeframe Works Best for Trading Fair Value Gaps?
There is no single best timeframe. The correct answer depends on how the trader structures their analysis.
ICT methodology uses a top-down approach. The higher timeframe (Daily or 4H) is used to determine the bias — is price in a premium or discount? Has liquidity been swept? What is the draw? Once that is established, the trader drops to an intermediate timeframe (1H or 15M) to identify the FVG they plan to trade. Then they drop to the execution timeframe (5M or 1M) to time the entry with precision.
Higher timeframe FVGs (4H, Daily) are more reliable because they represent a larger institutional footprint. When a daily FVG holds, the reaction tends to be clean and the move that follows is substantial. Lower timeframe FVGs are useful for refining entries and reducing stop distance but should always be used within the context set by the higher timeframe.
How Is a Fair Value Gap Different From an Order Block?
These two concepts are closely related and often appear together, but they are not the same thing.
An order block is the last opposing candle before a strong impulsive move. It marks the specific candle where institutional orders were loaded before price moved aggressively in one direction. The order block is the cause — it identifies where smart money entered the market.
A fair value gap is the imbalance left behind by that move. It is the effect — the evidence that the move was driven by institutional aggression. The FVG is what gets left in the wake of the order block being triggered. It shows how much imbalance was created as a result of that institutional entry.
Both are PD arrays. Both attract price when it retraces. But their roles are different and they should not be used interchangeably.
| Factor | Fair Value Gap | Order Block |
|---|---|---|
| What it is | Imbalance zone left by a strong move | Last opposing candle before a strong move |
| Role in the model | The effect — evidence of institutional aggression | The cause — origin of institutional orders |
| How it is drawn | Rectangle between candle 1 high and candle 3 low | Rectangle covering the body of the last opposing candle |
| What it marks | Price range that was not traded through equally | Candle where smart money loaded positions |
| Reaction type | Price fills the imbalance before continuing | Price returns to the origin candle for continuation |
| Confluence | Stronger when paired with an order block | Stronger when an FVG is also present (unicorn model) |
| Invalidation | Price closes through the full gap | Price closes through the full order block candle |
In the unicorn model, they overlap — which is why that setup is considered so high-confluence. You have both the institutional origin (order block) and the imbalance confirmation (FVG) at the same price level.
What Are the Most Common Mistakes When Trading Fair Value Gaps?
Trading FVGs without higher timeframe context. An FVG in isolation means nothing. If the daily bias is bearish, trading bullish FVGs on the 15-minute chart puts you directly against the institutional flow. Always establish the HTF bias first.
Ignoring whether liquidity was swept before the FVG formed. The cleanest FVGs form after a liquidity sweep — after price has taken out a swing high or swing low and reversed. An FVG that forms without a prior liquidity run is weaker because the institutional narrative is incomplete.
Entering FVGs in the wrong premium or discount location. In a bullish market, you buy in discount — below the equilibrium of the range. Buying from a bullish FVG that sits in premium means you are buying high. The setup may still work but the probability is lower.
Trading FVGs outside of kill zones. An FVG that forms at 2:00 PM New York time during dead hours carries far less weight than the same pattern forming during the New York open kill zone. Ignoring session timing is one of the most common reasons traders get clean-looking setups that simply fail to follow through.
Not having a defined invalidation level. Every FVG entry needs a clear level where the trade is wrong. For a bullish FVG, that is usually the low of the zone. If price closes through the bottom of the gap, the imbalance is filled and the trade is invalidated. Trading without this level leads to holding losers far too long.
Treating all FVGs equally. A 5-minute FVG and a 4-hour FVG are not the same thing. A standard FVG and an IFVG are not the same thing. Each type and each timeframe carries different weight and requires a different approach.
Can Fair Value Gaps Be Used on Any Market?
Yes. Fair value gaps are not a forex-specific or stocks-specific concept. Because they are based on price delivery mechanics — the way price moves when institutional orders are executed — they appear in every liquid market.
You will find FVGs on forex pairs, stock indices (ES, NQ, YM), individual stocks, crypto (Bitcoin, Ethereum), commodities (Gold, Oil), and futures markets. The pattern is the same everywhere because the underlying cause — aggressive institutional order flow — is present in every market where large participants trade.
That said, markets with higher liquidity tend to produce cleaner, more reliable FVGs. EUR/USD, NQ, ES, and Gold are markets where FVGs are widely respected and produce consistent reactions. Thinly traded assets can show the pattern but the fills are often erratic and the reactions less clean because there is less institutional participation driving the moves.

Muhammad Rohan
Rohan is an 3+ Years Experience in Smart Money Concepts (SMC) Specialized in liquidity, market structure & institutional order flow Focused on discipline, risk management & consistent profitability

Fouzia Sana
Fouzia Sana is a forex trader and market educator specializing in Smart Money Concepts (SMC). With a strong focus on liquidity analysis, market structure, and institutional order flow, she simplifies advanced trading concepts into practical, easy-to-understand strategies. Her work emphasizes disciplined trading, risk management, and consistency in execution.