Table of Contents
- What Is the ICT 30 Second Model?
- What Is the ICT Son Trading Model Strategy?
- Common Bullish Liquidity Targets
- Common Bearish Liquidity Targets
- Bullish Liquidity Sweep Example
- London Session
- New York Session
- Stop Loss Placement
- Is the ICT 30 Second Model profitable?
- Is the ICT 30 Second Model beginner friendly?
- Does the strategy work on crypto?
- Q: Is the 30-second chart mandatory?
The ICT 30 Second Model, also known as Son’s Model or Cameron’s Model, is a high-precision scalping framework built around liquidity sweeps, institutional manipulation, Fair Value Gaps (FVGs), and ultra-low timeframe execution. The strategy is designed to help traders align with smart money delivery rather than reacting emotionally to short-term price movement.
What Is the ICT 30 Second Model?
The model is based on the idea that price often raids liquidity in the opposite direction before reversing aggressively toward the true Draw on Liquidity (DOL). Traders first identify market direction on higher timeframes such as the 15-minute or 1-hour chart, wait for a liquidity sweep on lower timeframes, and then execute trades on the 30-second chart using a Fair Value Gap retracement.
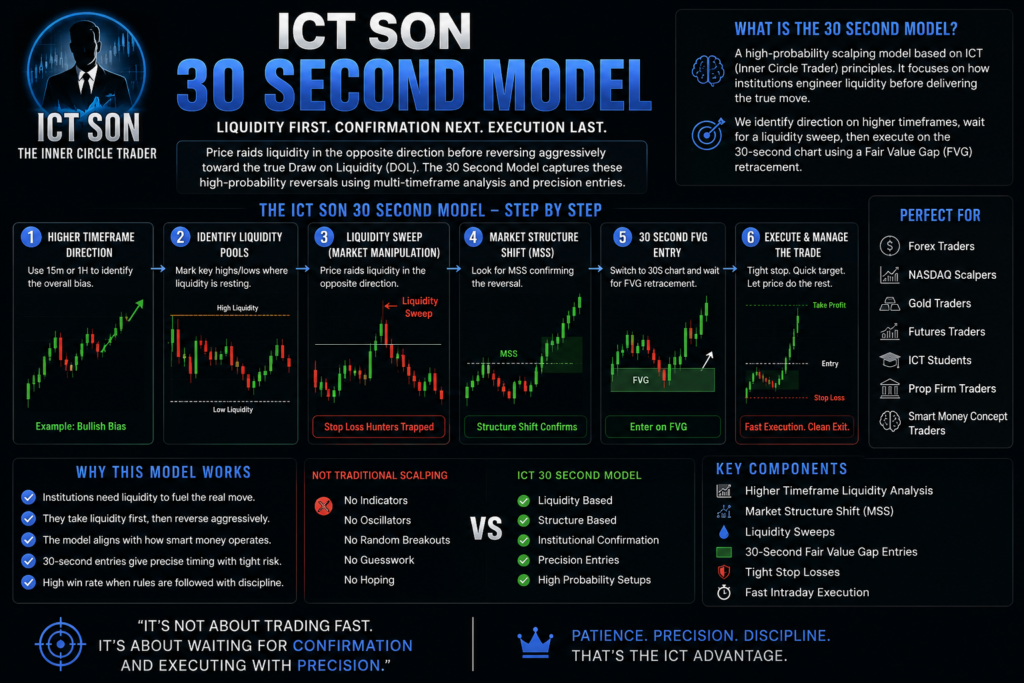
Unlike traditional scalping systems that rely on indicators, oscillators, or random breakout entries, the ICT 30 Second Model focuses on understanding how the market engineers liquidity before expansion. The model assumes that price rarely moves directly toward its true destination. Instead, algorithms first seek liquidity by trapping traders on the wrong side of the market before delivering the real move.
This concept is what makes the strategy extremely attractive to:
- Forex traders
- NASDAQ scalpers
- Gold traders
- Futures traders
- ICT students
- Prop firm traders
- Smart money concept traders
The strategy became popular because it combines:
- Higher timeframe liquidity analysis
- Market Structure Shift (MSS)
- Liquidity sweeps
- 30-second Fair Value Gap entries
- Tight stop losses
- Fast intraday execution
At its core, the ICT 30 Second Model is not about trading quickly. It is about waiting patiently for institutional confirmation and then executing with precision.
What Does the ICT 30 Second Model Mean?
The ICT 30 Second Model is a liquidity-based execution strategy where traders identify higher timeframe Draw on Liquidity (DOL), wait for the market to raid liquidity in the opposite direction, observe a Market Structure Shift, and then enter using a 30-second Fair Value Gap retracement.
In simple terms:
- Identify where price wants to go
- Wait for price to manipulate traders first
- Watch for rejection and displacement
- Enter on a precise FVG retracement
- Target higher timeframe liquidity
This creates a structured framework rather than emotional low-timeframe trading.
Why Is the ICT 30 Second Model Different From Normal Scalping?
Most retail scalping methods are reactive. Traders often buy after large bullish candles or sell after aggressive bearish momentum. This creates poor entries because institutions frequently use those emotional reactions as liquidity.
The ICT 30 Second Model works differently because it is built around market intent rather than indicator signals.
Traditional scalpers typically focus on:
| Traditional Scalping | ICT 30 Second Model |
|---|---|
| Indicators | Liquidity |
| Momentum chasing | Manipulation + reversal |
| Random entries | Structured execution |
| Emotional trades | Mechanical confirmation |
| Wide stops | Tight precision stops |
| Low context | HTF liquidity framework |
The strategy teaches traders to stop reacting emotionally to candles and instead understand why the market moved in a particular direction.
This is one of the most important differences between retail trading and smart money concepts.
What Is the ICT Son Trading Model Strategy?
The central idea behind the model is that markets seek liquidity before expansion.
Institutional traders cannot enter massive positions efficiently unless liquidity exists. Retail traders unknowingly provide that liquidity through:
- Stop losses
- Breakout entries
- Emotional reversals
- Panic exits
Because of this, price often moves opposite the intended direction first.
For example, if the market truly wants to move bullishly, algorithms may first push price lower to sweep sell-side liquidity. Once enough liquidity has been collected, the market reverses aggressively upward.
This creates the sequence the strategy relies on:
| Phase | Purpose |
|---|---|
| Draw on Liquidity | Identify target |
| Liquidity Sweep | Trap traders |
| Displacement | Show intent |
| MSS | Confirm reversal |
| FVG Entry | Precision execution |
| Expansion | Deliver price |
This sequence is the foundation of the entire model.
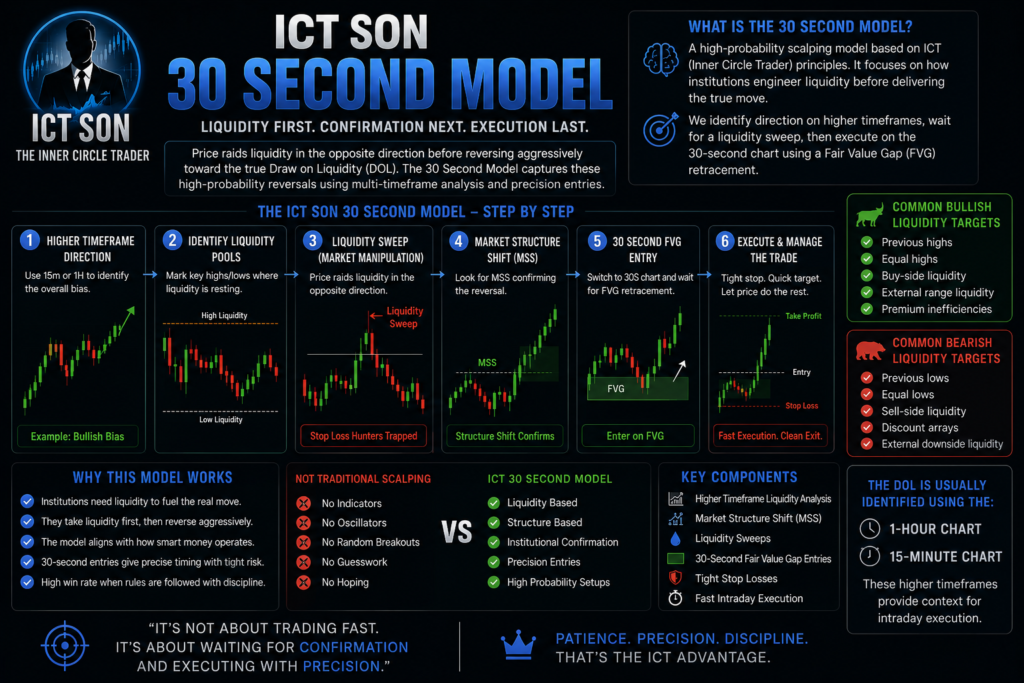
Common Bullish Liquidity Targets
When price is expected to move upward, traders may target:
- Previous highs
- Equal highs
- Buy-side liquidity
- External range liquidity
- Premium inefficiencies
Common Bearish Liquidity Targets
When price is expected to move downward, traders may target:
- Previous lows
- Equal lows
- Sell-side liquidity
- Discount arrays
- External downside liquidity
The DOL is usually identified using the:
- 1-hour chart
- 15-minute chart
These higher timeframes provide context for intraday execution.
How Does Liquidity Sweep Work in the ICT 30 Second Model?
The liquidity sweep is the manipulation phase of the setup.
This is where the market intentionally moves against the expected direction to collect liquidity before reversing.
Many beginner traders misunderstand this movement and assume the market is truly reversing. In reality, the sweep is often engineered to trap emotional traders.
Bullish Liquidity Sweep Example
Suppose the higher timeframe suggests price wants to move upward.
Before expanding higher, price may:
- Drop below recent lows
- Trigger stop losses
- Encourage traders to short
- Create panic selling
Immediately after collecting liquidity, the market rejects aggressively upward.
This rejection signals that the downside movement was likely manipulation rather than genuine bearish continuation.
Why Does the Strategy Use the 30-Second Chart?
The 30-second chart exists for precision execution.
The higher timeframe provides directional context, but the 30-second timeframe allows traders to refine entries with extreme accuracy.
This creates several advantages.
| Benefit | Why It Matters |
|---|---|
| Smaller stop loss | Reduced exposure |
| Better risk-to-reward | Improved trade efficiency |
| Earlier entry | Capture more expansion |
| Reduced drawdown | Better precision |
| Faster confirmation | Cleaner execution |
Instead of risking large stop losses, traders can often place stops directly beyond the liquidity sweep.
This is especially powerful in volatile markets such as:
- NASDAQ
- Gold
- GBPUSD
- EURUSD
The sequence becomes highly structured:
- Identify DOL
- Wait for sweep
- Observe displacement
- Confirm MSS
- Enter at FVG retracement
What Are the Best Trading Sessions for the ICT 30 Second Model?
Timing is extremely important.
The strategy performs best during periods where institutional activity and liquidity are highest.
London Session
The London Open frequently produces aggressive liquidity sweeps and displacement moves because of increased participation.
New York Session
The New York Open is one of the most effective environments for the strategy because volatility increases significantly.
Especially important periods include:
- 8:30 AM EST economic releases
- 9:30 AM EST NY Open
- Major USD news events
Why Do Traders Fail With the ICT 30 Second Model?
Despite the simplicity of the framework, many traders misuse the strategy.
One common mistake is ignoring higher timeframe bias. Traders attempt to trade every Fair Value Gap without understanding where the market actually wants to go.
Another issue is entering before the liquidity sweep occurs. Patience is essential. The manipulation phase must happen first.
Many traders also chase displacement candles emotionally rather than waiting for retracement into the FVG.
This creates poor entries and weak risk-to-reward ratios.
Overtrading is another major problem. Because the strategy uses low timeframes, traders feel pressured to constantly search for setups. In reality, only a few high-quality opportunities appear each session.
Discipline is what gives the model its edge.
ICT 30 Second Model Risk Management Rules
Risk management is one of the strongest aspects of the strategy because entries are highly precise.
Stop Loss Placement
For bullish setups:
- Stop goes below the liquidity sweep low
For bearish setups:
- Stop goes above the liquidity sweep high
The objective is to keep risk tight while allowing enough room for price fluctuation.
Typical Stop Sizes by Market
| Market | Typical Stop |
|---|---|
| NASDAQ (NQ) | 10–12 points |
| ES Futures | 2–3 points |
| Forex | Few pips |
| Gold | Session-dependent |
Because the entries are refined using the 30-second chart, stops remain relatively small.
What Targets Do ICT Traders Use?
Most traders target:
- 1:1 risk-to-reward
- 1:2 risk-to-reward
- Opposing liquidity
- Higher timeframe DOL
Some traders scale partial profits while leaving a runner toward larger liquidity objectives.
This creates flexibility depending on volatility conditions.
Frequently Asked Questions About the ICT 30 Second Model
Is the ICT 30 Second Model profitable?
The strategy can be highly effective when combined with discipline, session timing, liquidity understanding, and proper risk management. However, no trading strategy guarantees profits.
Is the ICT 30 Second Model beginner friendly?
The strategy is considered intermediate to advanced because traders must understand:
Liquidity
MSS
FVGs
Session behavior
Higher timeframe context
Does the strategy work on crypto?
It can work on crypto, but liquidity behavior in crypto is less consistent compared to forex and futures markets.
Q: Is the 30-second chart mandatory?
No. Some traders execute using the 1-minute chart, but the 30-second timeframe provides greater precision.
Final Thoughts on the ICT 30 Second Model
The ICT 30 Second Model is not simply a fast scalping technique. It is a complete liquidity-based execution framework designed around institutional behavior.
The real edge does not come from the 30-second timeframe itself. The edge comes from understanding why price manipulates traders before expansion.
When traders combine:
- Higher timeframe Draw on Liquidity
- Liquidity sweeps
- Market Structure Shift
- Fair Value Gap entries
- Session timing
- Disciplined risk management

Muhammad Rohan
Rohan is an 3+ Years Experience in Smart Money Concepts (SMC) Specialized in liquidity, market structure & institutional order flow Focused on discipline, risk management & consistent profitability

Fouzia Sana
Fouzia Sana is a forex trader and market educator specializing in Smart Money Concepts (SMC). With a strong focus on liquidity analysis, market structure, and institutional order flow, she simplifies advanced trading concepts into practical, easy-to-understand strategies. Her work emphasizes disciplined trading, risk management, and consistency in execution.