Table of Contents
- What Does NDOG Stand For and How Is It Defined in ICT?
- What are the Key Components of NDOG ?
- Why Does the ICT New Day Opening Gap Matter to Professional Traders?
- How Does the ICT New Day Opening Gap Form Each Trading Day?
- How Do Institutions Actually Use the NDOG Compared to Retail Gap Traders?
- What Is the Difference Between NDOG and NWOG in ICT?
- How Do You Identify the ICT New Day Opening Gap Correctly on a Chart?
- What Does a Complete Bullish NDOG Setup Look Like in ICT?
- What Does a Complete Bearish NDOG Setup Look Like in ICT?
- Which Kill Zones Produce the Strongest ICT NDOG Reactions?
- How Does NDOG Align With Fair Value Gaps to Create High-Probability Entries?
- What Are the Most Common Mistakes Traders Make When Trading the NDOG?
- Frequently Asked Questions About ICT New Day Opening Gap
- What is the ICT New Day Opening Gap in simple terms?
- Does every NDOG need to fill?
- What time does the ICT trading day begin for NDOG purposes?
- Is the NDOG the same as a Fair Value Gap?
- Which session is best for trading the NDOG?
- Can NDOG setups be used with SMT Divergence?
- How is the NDOG different from the Weekly Opening Gap?
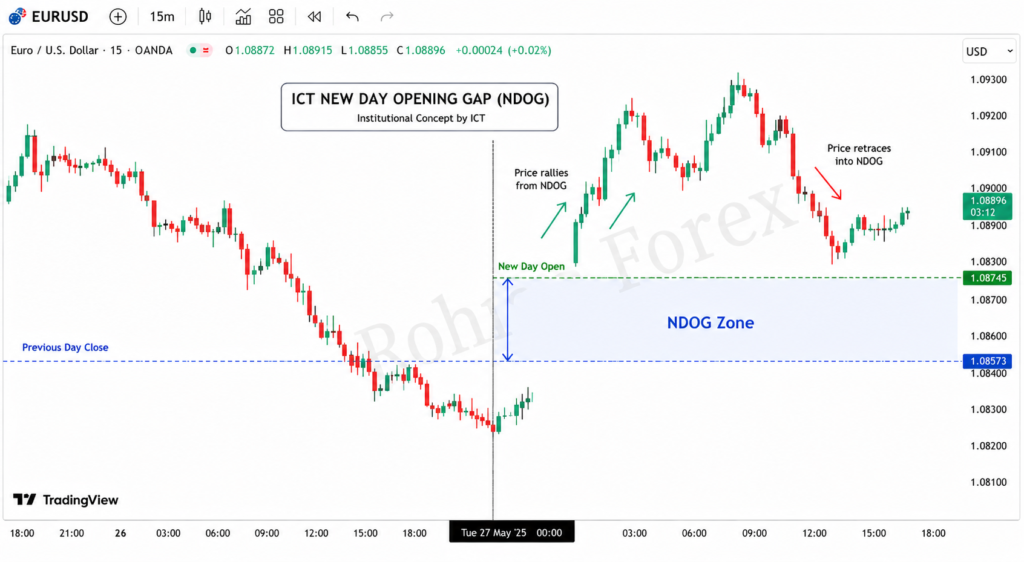
The ICT New Day Opening Gap (NDOG) is represents the price imbalance created between the previous trading day’s closing price and the new trading day’s opening price. For traders operating inside the Smart Money Concepts framework, this gap is not a coincidence or random market behavior. It is an institutional footprint — a signal that price delivery has left an unresolved inefficiency that algorithms may seek to revisit, reprice, or react against throughout the trading session.
Most retail traders look at gaps and think in simple terms: will it fill or not? ICT methodology forces a much deeper question. Why did the gap form? Where does liquidity rest near it? What is the institutional narrative for the day? How does the gap align with session timing, daily bias, and broader market structure? When a trader can answer all of these questions before price arrives at the gap, the NDOG becomes one of the most powerful tools in intraday analysis.
This guide covers everything you need to know about the ICT New Day Opening Gap — from its definition and formation logic to full trade setups, session timing, and how to combine it with other Smart Money concepts for maximum confluence.
What Does NDOG Stand For and How Is It Defined in ICT?
NDOG stands for New Day Opening Gap it is the space between where the previous trading day ended and where the new trading day began. That space — even if it is only a few pips wide — represents an imbalance in price delivery. Price moved from one level to another without trading through the range in between, meaning the market skipped over that area entirely.
In ICT methodology, this imbalance matters because Algorithms are programmed to seek balance, reprice areas of thin delivery, and use these zones as reference points for engineered liquidity sweeps and reversals. The NDOG therefore becomes an anchor for the entire day’s narrative.
What are the Key Components of NDOG ?
NGOD has the following compnent
- Previous day close — the final candle’s closing price before the session ends
- Current day open — the first candle’s opening price when the new session begins
- Gap body — the price range between those two levels, which forms the imbalance zone
- Gap midpoint — often used as a mean threshold reference for reaction analysis
- Extension area — the zone is extended forward on the chart until price interacts with it
The gap is marked as a rectangular zone on the chart and kept active until price has fully traded through it, reacted significantly, or become structurally irrelevant to the current session’s narrative.
Why Does the ICT New Day Opening Gap Matter to Professional Traders?
The NDOG matters because it reveals where price has not traded. In a market driven by algorithmic delivery, untraded areas carry gravitational pull. Institutions that repositioned during the overnight session or rollover period left an imbalance behind. That imbalance creates what ICT describes as an inefficiency — a zone the market may return to as part of its natural repricing process.
Professional traders monitor the NDOG because it generates repeatable, high-probability behavior. Price does not always fill the gap immediately, and it does not always fill completely. But it consistently reacts around the gap in one of several predictable ways: it retraces into the gap and reverses, it fills the gap and continues in the original direction, it uses the gap as support or resistance, or it explodes through the gap on high-volume institutional delivery. Each of these behaviors creates a tradeable setup when combined with proper confirmation.
The deeper reason the NDOG matters is psychological and structural. Retail traders tend to chase the opening move, enter breakouts, and place stops at logical levels near the open. Institutions exploit this by engineering price into those stop clusters before reversing. The NDOG frequently sits right at the center of that manipulation, which is why understanding it protects traders from becoming the liquidity that institutions need to fill their orders.
How Does the ICT New Day Opening Gap Form Each Trading Day?
The NDOG forms every single trading day because no market session transitions seamlessly from close to open at the exact same price. The formation process is consistent across all major markets. Here is how it develops:
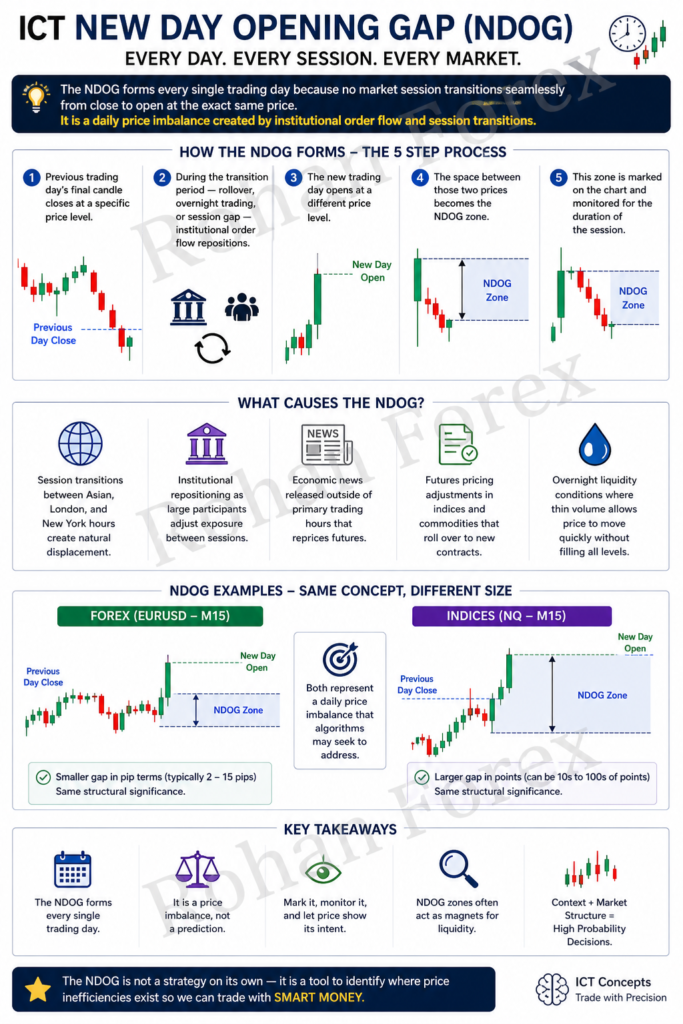
- The previous trading day’s final candle closes at a specific price level
- During the transition period — rollover, overnight trading, or session gap — institutional order flow repositions
- The new trading day opens at a different price level
- The space between those two prices becomes the NDOG zone
- This zone is marked on the chart and monitored for the duration of the session
Several factors cause the gap to form with varying degrees of size and significance:
- Session transitions between Asian, London, and New York hours create natural displacement
- Institutional repositioning as large participants adjust exposure between sessions
- Economic news released outside of primary trading hours that reprices futures
- Futures pricing adjustments in indices and commodities that roll over to new contracts
- Overnight liquidity conditions where thin volume allows price to move quickly without filling all levels
In forex markets like EURUSD or GBPUSD, the NDOG tends to be smaller in pip terms. In index markets like NQ or ES, the gap can be considerably wider, especially after major data releases. Both carry the same structural significance — a price imbalance that algorithms may seek to address.
How Do Institutions Actually Use the NDOG Compared to Retail Gap Traders?
This is where ICT methodology separates itself completely from conventional gap trading approaches. The table below illustrates the core philosophical difference:
| Retail Gap Trading | ICT NDOG Trading |
|---|---|
| Focus on whether the gap fills | Focus on why the gap formed |
| Chase momentum into the gap | Wait for liquidity sweep and confirmation |
| Use gap as a simple support or resistance level | Analyze gap within full institutional narrative |
| Enter at gap edge with limit orders | Enter after market structure shift is confirmed |
| Random stop placement | Stops placed beyond structural invalidation |
| One-dimensional analysis | Multi-layer confluence: structure + liquidity + time |
| No session awareness | Kill Zone timing is essential |
| Static setup | Context-driven, bias-dependent execution |
Retail traders assume the gap is a destination. ICT traders understand the gap is a mechanism — part of the algorithm’s delivery cycle. Institutions use the NDOG to engineer liquidity, trap breakout traders on both sides, and create the price conditions necessary to fill institutional orders before expansion begins in the true direction.
What Is the Difference Between NDOG and NWOG in ICT?
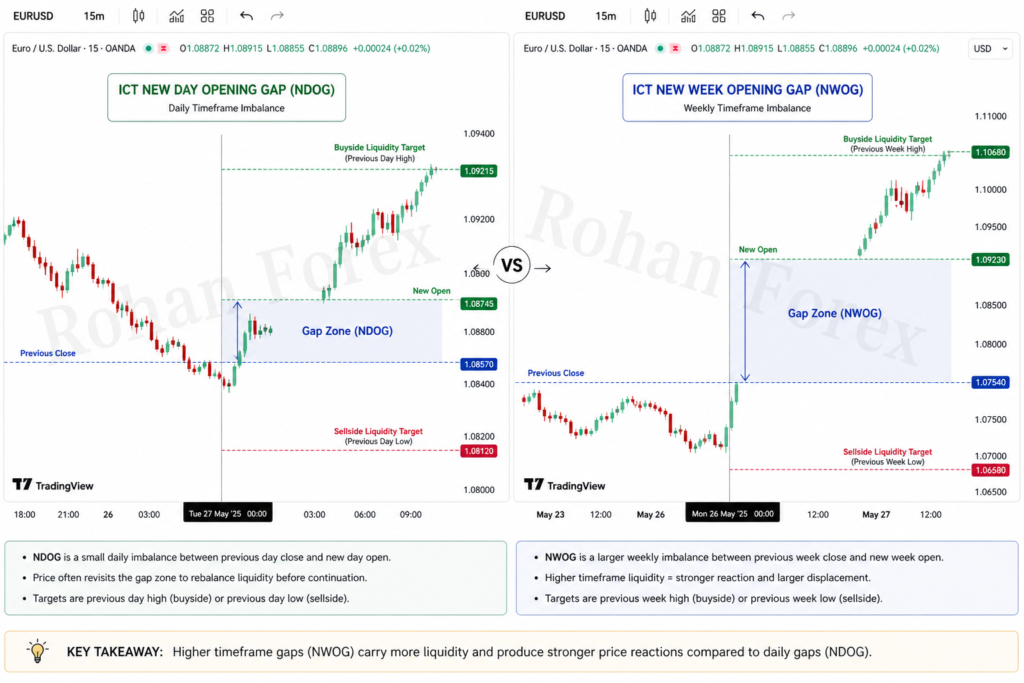
Many traders confuse the New Day Opening Gap with the New Week Opening Gap. Although they share the same logic, they operate on different time horizons and carry different levels of significance.
| Feature | NDOG (New Day Opening Gap) | NWOG (New Week Opening Gap) |
|---|---|---|
| Formation frequency | Every trading day | Once per trading week |
| Primary use | Intraday bias and session setups | Weekly swing bias and higher timeframe narrative |
| Timeframe focus | M1, M5, M15 execution | H1, H4, Daily context |
| Trader type | Day traders and scalpers | Swing traders and positional traders |
| Structural weight | Session-level reference | Higher timeframe reference |
| Frequency of reaction | Daily | Weekly |
Both gaps carry weight inside the ICT framework. When a NDOG aligns with a NWOG — meaning both the daily and weekly imbalances share similar price areas — the confluence significantly increases the probability of a meaningful market reaction.
How Do You Identify the ICT New Day Opening Gap Correctly on a Chart?
Correct identification is critical because drawing the NDOG incorrectly leads to false confluences and poor trade decisions. The process is straightforward but requires precision.
Step 1 — Locate the previous day’s final candle close Find the last candle that closed before the new trading day began. Use the exact closing price — not the wick, not a visual estimate.
Step 2 — Locate the current day’s opening price Find the opening price of the first candle of the new trading day. Again, use the exact level, not a rounded approximation.
Step 3 — Draw the NDOG zone Highlight the rectangular zone between these two price levels. If the open is above the previous close, the gap is bullish. If the open is below the previous close, the gap is bearish.
Step 4 — Mark the midpoint The midpoint of the gap zone often acts as the mean threshold — a level where the first significant reaction may occur.
Step 5 — Extend the zone forward Keep the NDOG visible on your chart throughout the session so you can monitor price behavior as it approaches or interacts with the zone.
Step 6 — Reassess after interaction Once price has fully traded through the gap or has produced a clear reaction (displacement, structure shift, or continuation), reassess whether the zone remains relevant for the remainder of the session.
What Does a Complete Bullish NDOG Setup Look Like in ICT?
A bullish NDOG setup combines institutional logic with session timing and confirmation. The following is the standard structure that professional ICT traders look for:
Daily bias must be confirmed as bullish before anything else. Without a bullish narrative, any reaction inside the gap has lower probability. Daily bias is assessed using previous day highs and lows, premium and discount arrays, and higher timeframe market structure.
Once bias is confirmed, the setup develops as follows:
- Price trades down below the NDOG zone during the London Open or early New York session
- Sell-side liquidity gets swept — equal lows, Asian session low, or previous day low are consumed
- Price aggressively reclaims the NDOG, closing candles back inside or above the gap
- A bullish displacement candle appears, leaving a Fair Value Gap on the lower timeframe
- Market structure shifts upward — a short-term lower high is broken to the upside
- Entry is taken on a retracement into the bullish FVG or order block, not by chasing price
- Stop loss is placed below the liquidity sweep point — beyond structural invalidation
- Target is set at buy-side liquidity above: equal highs, previous day high, or session high
This setup works because institutions engineered the drop below the gap to consume resting sell-side liquidity before expanding higher. Retail traders who shorted the breakdown become the fuel for the reversal.
What Does a Complete Bearish NDOG Setup Look Like in ICT?
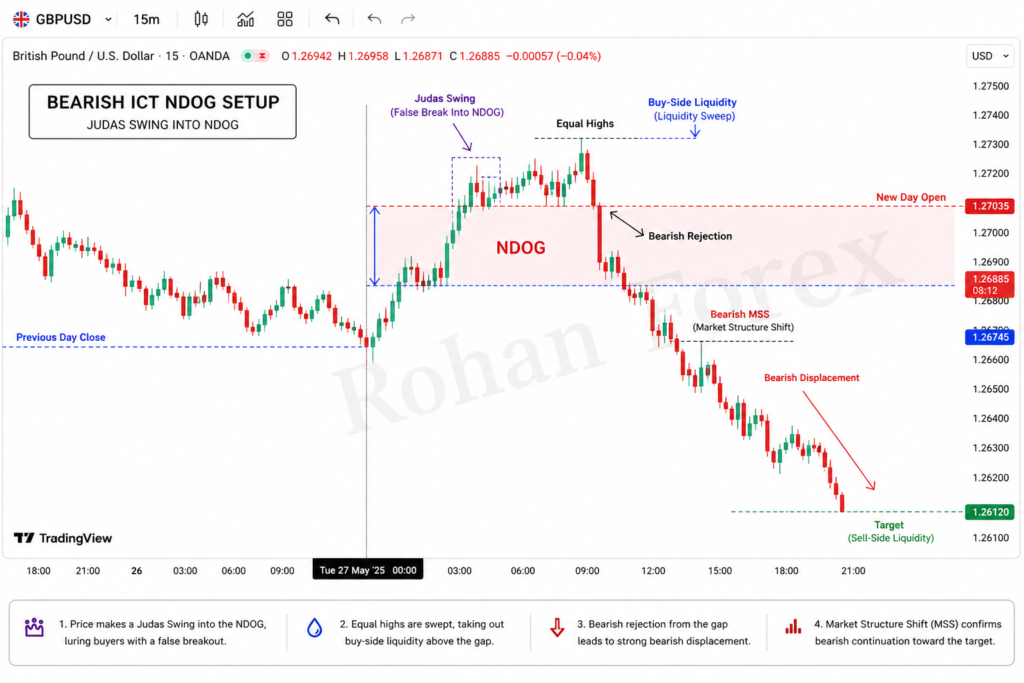
The bearish version follows the same logic in reverse, using premium arrays and buy-side liquidity sweeps as the trigger:

- Daily bias is confirmed bearish based on higher timeframe structure and dealing range position
- Price rallies into the NDOG zone during the Judas Swing phase of the London or New York Open
- Buy-side liquidity gets swept — equal highs, Asian session high, or previous day high are consumed
- Price rejects sharply from inside the NDOG with a bearish displacement candle
- A bearish Fair Value Gap forms on the M5 or M1 chart
- Market structure breaks downward with a confirmed short-term high failing
- Entry is taken on a retracement into the bearish FVG or bearish order block
- Stop loss sits above the liquidity sweep high — beyond structural failure
- Target is set at sell-side liquidity below: equal lows, previous day low, or session low
Which Kill Zones Produce the Strongest ICT NDOG Reactions?
Kill Zones are the time windows during which institutional participation is highest and algorithm-driven price delivery is most reliable. Not all hours are equal. The NDOG produces its strongest reactions during specific windows, and trading outside these windows significantly reduces setup quality.
The most effective Kill Zones for NDOG trading are:
London Open Kill Zone — 2:00 AM to 5:00 AM EST This is often where the Judas Swing originates. Price will manipulate the Asian session range, frequently sweeping below or above the NDOG before the true directional move begins. The NDOG is most useful during this window for identifying manipulation versus real breakouts.
New York Open Kill Zone — 7:00 AM to 9:00 AM EST This is the highest-volume period and produces the most significant NDOG reactions. Institutional order flow is at its peak. Price often delivers aggressively through or away from the gap during this window, creating displacement, Fair Value Gaps, and clear market structure shifts.
New York AM Session — 9:30 AM to 11:00 AM EST Equities open during this window, adding volume to index and correlated forex pairs. NDOG setups that did not complete during the New York Open sometimes develop here.
Sessions to avoid for NDOG trading:
- Asian session (outside of marking the range for reference)
- New York lunch hours — 12:00 PM to 1:30 PM EST (low liquidity, choppy delivery)
- After 2:00 PM EST (institutional activity winds down)
How Does NDOG Align With Fair Value Gaps to Create High-Probability Entries?
The Fair Value Gap and the NDOG are both imbalances, but they are different types. A Fair Value Gap is a three-candle imbalance on any timeframe — the gap between the wick of candle one and the wick of candle three when candle two displaced strongly. The NDOG is a daily session imbalance between close and open.
When both imbalances share the same price area, the probability of a reaction increases substantially. Here is why: the algorithm is now seeking to balance two different types of inefficiency at the same location. That overlap creates what ICT refers to as confluence — multiple reasons to expect price to react at a specific level.
A practical example in EURUSD during the New York Open:
- The NDOG sits between 1.0852 and 1.0861
- Price sweeps sell-side liquidity below the gap and reverses
- On the M5 chart, a bullish Fair Value Gap forms between 1.0854 and 1.0857 — directly inside the NDOG
- Market structure shifts bullish on M5
- Entry is taken at the FVG with stop below the sweep
- Target is the session high and previous day high
This is how ICT traders build high-confluence, low-risk setups around the NDOG.
What Are the Most Common Mistakes Traders Make When Trading the NDOG?
Understanding what to avoid is as important as knowing the setup itself. These are the most frequent errors observed in NDOG trading:
- Trading every gap without context — Not every NDOG is tradeable. Gaps that form inside strong trend continuation phases or ahead of major news events carry far less predictive value.
- Ignoring daily bias — A bullish NDOG setup inside a bearish narrative is a low-probability trade regardless of how clean the pattern looks on a lower timeframe.
- Entering without a market structure shift — The gap alone is not confirmation. Price must show displacement and a structural break before entry is valid.
- Trading during low-liquidity hours — NDOG setups during the Asian killzone or New York lunch session fail more frequently because institutional participation is minimal.
- Chasing price after displacement — Waiting for a retracement into a Fair Value Gap or order block is essential. Entering after a large displacement candle puts traders at poor risk-to-reward.
- Misidentifying the gap — Using wicks instead of candle body closes to draw the NDOG zone creates inaccurate levels that produce false signals.
- Overleveraging — A valid setup executed with excessive risk destroys accounts even when the directional bias is correct. Maximum risk should not exceed 1% to 2% per trade.
Frequently Asked Questions About ICT New Day Opening Gap
What is the ICT New Day Opening Gap in simple terms?
The NDOG is the price gap between where the previous trading day closed and where the new trading day opened. ICT methodology treats this gap as an imbalance zone that institutions may reprice during the session.
Does every NDOG need to fill?
No. Some gaps fill completely, some fill partially, and some act as support or resistance without filling at all. The behavior depends on daily bias, session timing, and where liquidity rests relative to the gap.
What time does the ICT trading day begin for NDOG purposes?
Most ICT traders use the New York midnight open (00:00 EST) as the start of the new trading day. Some use the 5 PM EST rollover depending on their broker’s daily candle structure. Consistency with your specific chart feed matters more than following a universal rule.
Is the NDOG the same as a Fair Value Gap?
No. A Fair Value Gap is a three-candle imbalance that can form on any timeframe. The NDOG is a specific daily imbalance between the previous close and current open. Both are imbalances, but they form through different mechanisms and are marked differently on charts.
Which session is best for trading the NDOG?
The New York Open Kill Zone (7:00 AM to 9:00 AM EST) and the London Open Kill Zone (2:00 AM to 5:00 AM EST) produce the strongest and most reliable NDOG reactions.
Can NDOG setups be used with SMT Divergence?
Yes. SMT Divergence — where two correlated instruments diverge at a key level — adds powerful confirmation to NDOG setups. For example, if EURUSD sweeps below the NDOG but GBPUSD does not make a new low at the same time, SMT Divergence confirms the sweep was manipulation rather than genuine directional selling.
How is the NDOG different from the Weekly Opening Gap?
The NDOG is a daily imbalance used for intraday bias. The NWOG is a weekly imbalance used for higher timeframe swing bias. Both work on the same logic but on different time horizons. When they align at a similar price area, confluence increases significantly.

Muhammad Rohan
Rohan is an 3+ Years Experience in Smart Money Concepts (SMC) Specialized in liquidity, market structure & institutional order flow Focused on discipline, risk management & consistent profitability

Fouzia Sana
Fouzia Sana is a forex trader and market educator specializing in Smart Money Concepts (SMC). With a strong focus on liquidity analysis, market structure, and institutional order flow, she simplifies advanced trading concepts into practical, easy-to-understand strategies. Her work emphasizes disciplined trading, risk management, and consistency in execution.